
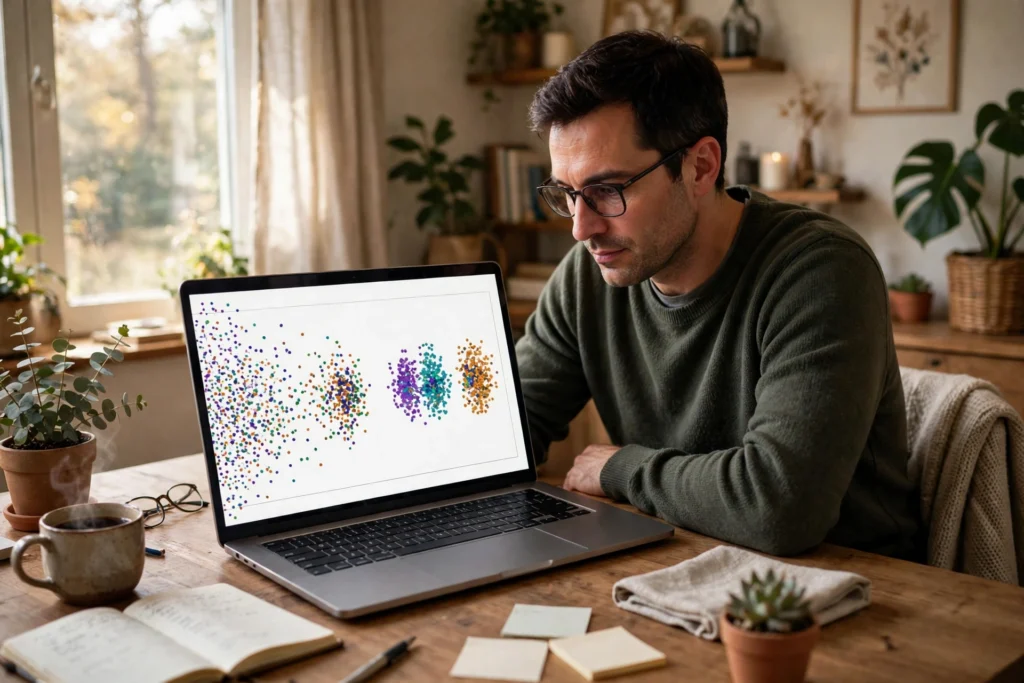
Unsupervised learning is a way for AI to find structure in data that has no labels. Instead of being told which examples belong in which group, the system compares examples with each other, spots similarities, and organises them into groups, links, or simpler summaries that a person can then inspect and use.
Key Takeaways
- Unsupervised learning works on unlabeled data: nobody has tagged each example with the “right answer” first.
- Its main jobs are clustering similar items, finding associations between items, and reducing many measurements to a simpler view.
- It is best for exploration, not for giving a final yes-or-no answer on its own.
- The groups it finds still need a human to check whether they make sense and are useful.
- It pairs naturally with supervised learning, covered in our guide to supervised learning.
What is unsupervised learning, exactly?
Think of a box of photographs with no captions. You could still sort them: beach photos in one pile, mountain photos in another, close-ups of flowers in a third. You would not need anyone to label them first. You would use what the photos look like.
Unsupervised learning does something similar, only with numbers. A photo, a customer record, or a sentence is turned into measurements — colours, sizes, words, purchase habits — and the system groups examples that are close to each other on those measurements. That is why it sits inside the wider field explained in our complete guide to artificial intelligence and in machine learning, rather than being a separate kind of magic.
The word “unsupervised” can mislead. It does not mean nobody is involved. People still choose the data, pick the measurements, set the method, and judge the result. What is missing is a label for every example — and labelling thousands or millions of examples by hand is often slow, expensive, or simply not possible.
How is it different from supervised learning?
In supervised learning, each training example comes with an answer. A model learns the link between example and label, then tries to predict labels for new examples. To tell cats from dogs, you first show it many labelled cat and dog photos.
In unsupervised learning, there is no answer key. The system is not scored on whether it picked the “correct” group, because no correct group was given. Instead, it is judged on whether the groups are tight, separated, stable, and useful for the job at hand.
That makes it a good starting point when you do not yet know what you are looking for. A shop might not know its customer groups in advance. A researcher might not know which patterns hide in a large set of readings. In both cases, an unsupervised method can suggest a first map of the territory, which people can then explore properly.
What are the three main types?
Most unsupervised methods fall into three broad families. They often overlap in practice, but keeping them apart helps you understand what a tool is actually doing.
1. Clustering: putting similar things together
Clustering groups examples that resemble each other. A common method, k-means, starts with a chosen number of groups, places a centre in each one, assigns every example to its nearest centre, then moves each centre to the middle of its group and repeats until the centres stop moving much.
Other methods work differently. Some build a tree, merging the closest groups step by step, so you can cut the tree at whatever level of detail suits you. Some look for dense patches and treat scattered points in between as outliers. Some allow an example to belong partly to more than one group, which fits messy real life better than a hard either-or split.

2. Association: finding things that tend to go together
Association looks for rules like “people who buy this often also buy that.” It counts how often items appear together, and how much more often than chance. Shops use it for product placement and recommendations, and streaming services use similar ideas to suggest what you might enjoy next. The catch is that a frequent pairing is not proof of a cause: bread and butter may land in the same basket simply because both are everyday staples.
3. Dimensionality reduction: making complex data simpler to see
When each example has dozens of measurements, it is hard to plot or even think about. Dimensionality reduction compresses those measurements into fewer, more useful ones while trying to keep the important differences between examples. A well-known method, principal component analysis, finds the directions along which the data varies most. This can make a chart readable, speed up later steps, and sometimes reveal that what looked like many separate features was really a handful of underlying patterns.
Turning text into numbers is a related step: our guide to embeddings explains how words become numbers that clustering methods can then compare.
Where is unsupervised learning used?
You have probably met its results without noticing. News apps group articles about the same story. Photo apps group faces and places. Shops group customers with similar buying habits so they can tailor offers — though a group is a starting point for a human decision, not a verdict about a person.
It also helps with quality checks. If most readings from a machine fall into a familiar pattern and a few sit far away, those few are worth a closer look. They might signal a fault, a data error, or simply something new. Anomaly detection works this way: learn what “normal” looks like, then flag what does not fit.
Why can the results be hard to trust?
Unsupervised results come with no answer key, so they need extra care. Three problems show up again and again.
First, the number of groups is often a choice, not a discovery. Ask for three groups and you get three; ask for ten and you get ten. Neither is automatically right. A sensible check is to try different numbers and see which grouping stays stable and makes sense to someone who knows the subject.
Second, the measurements you feed in shape the answer. If you include an irrelevant measurement, or leave out an important one, the groups will follow that distorted view. Two customers might look similar on spending alone but very different once you consider returns or support contacts.
Third, a neat group is not necessarily a meaningful one. An algorithm will happily split random noise into clusters if you ask it to. So the final step should always be human: look at examples from each group, read what they have in common, and ask whether the split helps you decide anything. If it does not, the grouping may be tidy but useless.
How do you judge a good result?
There is no single score that settles it, but a few practical checks help. Are the groups compact and well separated? Do similar results appear if you run the method again, or on a fresh sample? Can an expert describe each group in plain words without straining? And does using the groups improve a real decision — a clearer product range, a faster fault check, a better-organised archive?
If most answers are yes, the result is worth keeping. If the groups change wildly with small tweaks, or nobody can explain them, treat them as a hint to investigate further, not as a conclusion.

For a deeper technical reference, see IBM’s guide to unsupervised learning and the scikit-learn clustering documentation.
FAQs
Is unsupervised learning the same as AI learning on its own?
No. People still select the data, choose the features, pick the method, and interpret the output. “Unsupervised” only means the training examples are not labelled with correct answers in advance.
Can unsupervised learning predict the future?
Not directly. It describes structure in the data you already have. Those groups can feed into a predictive model afterwards, but the grouping step itself does not forecast what will happen next.
What is the difference between clustering and classification?
Classification assigns new examples to categories defined by labelled training data. Clustering creates the groups itself from unlabeled data, and a person then decides what, if anything, each group means.
Do you need a huge dataset for unsupervised learning?
Large datasets often help, because patterns are easier to separate from noise, but size alone does not guarantee a useful result. Clean, relevant measurements matter at least as much as volume.
When should you use supervised learning instead?
When you already know the categories or outcomes you care about and you can get labelled examples, supervised learning is usually the more direct route. Use unsupervised learning first when you are exploring, when labels are scarce, or when you suspect there are groups you have not yet named.
Conclusion: start by sorting, then ask what the piles mean
If you want to try the idea yourself, pick a small, familiar set — your book collection, a list of recipes, or a spreadsheet of monthly spending. Sort the items by hand, note what rule you used, then ask whether a different rule would give a different, equally sensible set of piles. That short exercise captures the heart of unsupervised learning: the machine can do the sorting at scale, but deciding which sorting matters is still a human job. Keep that judgement in the loop, and unsupervised methods become a useful way to explore data before you commit to answers.